Monday, June 11, 2018

Y16 Steel Pole 3D Mapping

Part of my job is to survey locations for power poles to be inserted. This requires many hours of careful planning to find the straightest and usually the most level areas for pole placement. Y16 is a project that goes from the north side of  Portage to the north side of Pairie du Sac, about 30+ miles of transmission poles will be needed for this project. One of the tools that would be beneficial to this project is a 3D projection of the transmission poles and a elevation profile of the area where they will be located.

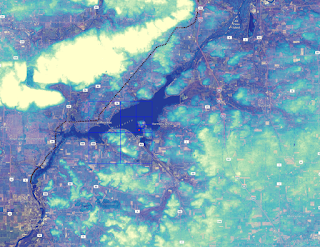
To do this project I used the staking data for the center hubs of the poles in order to locate their location. This data was projected in NAD 83 Wisconsin South so I set the projection to match the hubs and continued on with the project. I then used a DEM that I downloaded from the Wisconsin DNR  to get elevation data for the surrounding area. I used a 10m DEM to get basic elevation data and merged it with Bing Aerial photogrammetry data to create a map that holds true to the surrounding area.

DEM created using Bing and WI DNR data
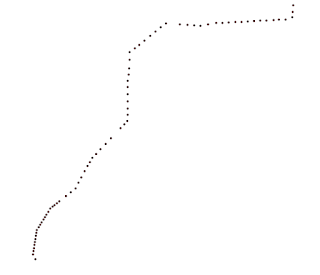
To create the point shape files from the CSV file that I had on the center hub stakes for the power poles I used the feature in QGIS to create a layer from a Delimited Text File. This allows me to use the coordinates that I had stored in the CSV file to be projected in QGIS as a point shape file.
Points created from CSV file


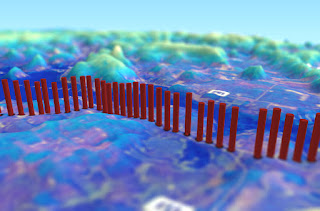
After the points have been successfully created I had to give it elevation data and create a 3D shape file for the power pole. I downloaded the QGIS2threejs app and used the point feature to give a cylinder object to the power poles. Then to give a width of the poles the value was set to 75 and height was set to a value of 100. The z-coordinate was set relative to the DEM so everything would sit flush and I wouldn't have any errors or floating points.

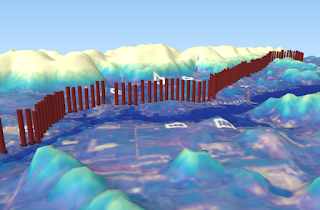
Elevation profile and location of Transmission Towers
The final map was created by adding the data from the created DEM into QGIS2threejs I set the base size to 600 and exaggerated the vertical projection by 6 to show the hills and reliefs of the Prairie Du Sac area. The final result is a aesthetically pleasing 3D map that shows elevation, pole location and direction of where the poles will be going. After using a few tilt shift filters I have a very pleasing 3D representation of  the Y16 project.
Y16 Elevation Profile

Bike Trails of Madison Wisconsin


Living in Madison has opened my door to a wide variety of outdoor activities that I haven't had access to while living in other cities like Eau Claire. I purchased a bicycle recently to travel around the city in a more Eco-friendly way. This is beneficial to me since it seems like every street in Madison is under construction right now and traffic is terrible! The biking culture in Madison is excellent, trails intersect and weave between downtown, west side, east side and even go to the belt line south of the city. Since Madison is such a bike friendly city I thought it would be a fun idea to dive into a different kind of road map. This map shows the diverse and well crafted bike trails throughout Madison Wisconsin.

This map was created using data supplied from Dane County, Open Street Map, and bicycle data from UW-Madison. I used the TIGER files from Dane County to show the belt line and highways. This data was used to gather a sense of scale and show how  you can get pretty much anywhere riding a bike in Madison. The Open Street Map data was used as a base layer but made transparent so you can see the bike trails and intersecting roads.


Most of the road data was omitted to focus more on the bike paths themselves. I also included the B-Cycle rental bike stations that are scattered throughout the city. These B-Cycle stations are cheap and easy to use for just a couple dollars a day and you can rent a bike cheaply and reliably in Madison. Bike Facilities are also found along major bike trails in case of accidents such as flat tires or a broken chain. This is one of the many reasons why Madison is such a bike friendly city.

This Bike map of Madison gives a large scale presentation of the bike trails in the city. The  city has quite a few trails that go from east side to the west side all the way to the belt line. Many people in Madison use these bike trails everyday to commute to work, get groceries or just for fun. The biking community in Wisconsin is on par with some European cities such as Amsterdam and Copenhagen. I for one, am very excited to start biking along this beautiful city to take in as much of the trails as I can and to skip traffic on my way to work.

Friday, September 22, 2017

Aesthetic Map of Madison Wisconsin

This map was created in QGIS using a shapefile from the USGS and road shapefiles from the Wisconsin Department of Transportation. This map was simple to do, all the roads were extracted from the road shapefile and depending if it was a heavily used road or a small street road the thickness of the line was decreased or increased.

The map was was then transferred to print composer where a title was added and additional tweaks to the coloring and scale were added. overall this was a fun project that shows maps can be aesthetic as well as informational.

Thursday, September 21, 2017

Cumberland Ski Trails

This map was created for the Cumberland Area Ski Trail Association, also known as CASTA.
The map was created with data collected on a trimble handheld unit shooting at 1 second intervals. After the data was collected it was then imported into the GIS platform Qgis for  analysis.

the trails were broken into separate selections based on the input I received from the CASTA board. elevation data was taken from the USGS DEM file and was interpolated with the lines that were imported from the data collected in the field. The elevation profiles were created using the Qgis plugin "Profile Tool."

To complete the trail map I then used the integrated Print Composer to create the final touches of the map including digitized water, symbolism, legend, and description. All this was used to create the CASTA ski trail map.


Monday, May 9, 2016

Navigation using UTM coordinate Maps

Introduction:

The previous lab from February had the students create maps based on UTM gridsthat had a navigation function using paces that were taken from a measured area. This data was then inserted into a map that would then be used for navigation in the field. Using these field maps in the area of study it was possible to use GPS and the created maps to find and collect points that were assigned to the group.

Area of Study:
The area of study is the Priory. The Priory is a UWEC returning student housing area for non traditional students. It was originally a priory for monks before it was re purposed for student housing. This is a residence hall that is set in 120 acres of woods that is inter-cut with semi moderated trails. Since this area is in the wilderness with a large area of woods it is easy to get lost and difficult to traverse.

Methods:
The original maps that were created in February were used to navigate the priory. before setting forth and collected the GPS coordinates onto a GPS device it was important to record the area that was hiked along the way. The GPS that was utilized has a function to switch from Lat and Long to UTM grid system. This was used to correspond to the maps that were originally created. It was at this point that we would have to find a way to prove we made it to the UTM points that were assigned to the group. This was accomplished by collecting a point in the GPS unit and by taking a picture that had location enabled. once the initial set up is completed the group decided to plot the assigned points onto the map to create a ease of access and navigation area. This was sort of a rudimentary navigation chart.
UTM Grid Map used (credit Rachel Hopps)

Once the initial set up was complete with the GPS unit and the map it was time to navigate to the points plotted. At the start up the group decided that it would be best to stick to areas that looked like they had a trail attached. This allowed the group to move from trail to point in a quick succession. However some points were located deep in the woods. to move quickly from point to point we jumped as fast as possible from point to point by going in as straight as lines as possible. This was difficult because of the heavy vegetation in some areas that forced the group to take drastically different directions in order to navigate the area which can be seen on the tracking data.

Collecting the first point with Rachel and Joseph

After the points were collected it was time to update the area in order to create a map. To do this we had to use the GPS number that was attached to the unit and the group number that was assigned in order to get the data. once the data was inserted into ArcGIS it was possible to see how well the group traversed the area.

One known problem that the group noticed is that the compass on the GPS was not the greatest for quick turn around. The compass is electronic and would take a few moments to adjust to the direction of the group. This made travel frustrating as the group would have to re adjust every 10 meters or so. Other sources of frustration came from the heavy amounts of vegetation and brambles about. The vegetation made travel difficult and with the brambles, sometimes painful. The map also did not contain some data that would be useful to the group. The data that would have been useful to the group would have been elevation data in the form of topographic maps since some of the points were in an elevated position this data would be useful and should not have been excluded

Tracking Path and collected coordinates
Results: 
For the majority of the experience we can see that the group made short work of the points with only a couple of instances where the point collected was difficult to traverse to. this is because the initial planning allowed the group to plan an approach as well as having a set job for each person. one person would be using the GPS unit for measuring the tracking and navigating with a compass, another would be using the UTM map to geed the coordinates that were needed to the GPS user and to count pace. The third and last person would be breaking the trail up for ease of travel and would take pictures and notes. By using a three person team it was possible to create a sort of oblong circle to collect all the points which were then inserted into ArcGIS

Conclusion: 
Collecting data in the field is the prime example of geography. Some agencies require field methods and the ability to create a accurate map and to use the GPS and UTM coordinate map created for a Area of study is invaluable for many companies and profiles. This area of study and map creation and field navigation is useful for surveying, search and rescue and many other applications. 
Tuesday, May 3, 2016

Processing UAS Data in Pix4D


Processing UAS data in Pix4D

The Pix4D software is a Drone Mapping Software for professional drone based mapping purely from images that are taken with an aerial mapping platform. It is possible to use the Pix4D software to create cutting edge results that include but are not limited to Thermal mapping and 3D mapping. It is a useful software that is used in a variety of industries including emergency response, agriculture, mining and real estate. It is a easy to use program that almost anyone can pick up and enjoy.

How to use Pix4D:

Before starting a project it is important to have a image acquisition plan. This is an important step to create keypoints. Key points are a characteristic point found in an image. When 2 key points on 2 different images are found to be the same they are called matched key points, each match Key point will produce a 3D point. The more points captured the more accurately 3D points will be computed. So a high overlap of images is required, at the very least 75% frontal overlap and 60% side overlap is needed. If the user is flying over a homogeneous area such as sand/snow or a uniform field like agriculture lands it is important to increase the overlap to the images by at least 85% frontal overlap and 70% side overlap. Flying higher will also improve the results as well as having accurate image geolocation available.  An available tool for use is rapid check, rapid check is used to verify the proper ares and coverage of a data collection. The Pix4D software is also able to process multiple flights. The pilot does need to make sure that each plan captures the images with enough overlap and that there is enough overlap between the 2 image acquisition plans under the same weather conditions. It is also important that the flight height should not be too different between the flights since this can change the spatial resolution.

In order to produce oblique images the type of data that we need to take is the GSD or Ground sampling distance. It is advised to create Ground Control Points (GCP) if no GCP are used than the scale and orientation constraints can be used. If neither GCPs or constraints are used the final result will have no scale, orientation and no absolute position information. This will make it impossible to use for measurements, overlay and comparison. Finally when the process runs through the Pix4D system we will get a quality report which will report the information computed during the process. This will give us information regarding how many points were acquired the amount of overlay obtained and a summary of the project which can have the AGD, and the amount of area covered.

Methods: 

To use the software we will have to import images that were captured with a UAV device. this could be a multi bladed copter or a fixed winged UAV. After the initail mission is completed and it is time to import the data into Pix4D w must use the Project selection tool. this will import all the data into the program to utilize for later. 

After we select the image properties and where the output file will be located it is time to run the Pix4D program. The Pix4D program to find areas where overlaying occurs and will draw points data and create a area that can be used for three dimensional analysis. 


When the initial process is completed we can then complete a point cloud mesh and create a DSM orthomosaic with indexing. this process takes a long time to complete so it is best to set the program to run and then grab dinner or complete other required work. After the completion of the Point cloud and Mesh with the DSM and Orthomosaic index we then have a completed area that can be used for a variety of other useful applications such as three dimensional maps.
 What is left after the indexing is a summary of what has been completed this holds a varity of information such as the total amount of points collected. The completed GSD and the total area that is covered. what is also completed in the program is a wire mesh of the area selected. 


Conclusion:

The pix4d program is a intense program that can be useful to the geographer who is using the UAV for mapping purposes. by using overlaying pictures it is possible to create a three dimensional map that can be later used for a variety of applications including areas that are quite large. the amount of accuracy that can be utilized is also impressive considering that the amount of time to fly a UAV to the selected area and take the amount of pictures required only needs a small amount of time in relation to how it would be to do the same thing manually. Pix4D is an impressive tool that can be utilized to great extent in areas such as surveying, evacuation data and medical and emergency services.

Tuesday, April 26, 2016

Topographic Survey with total station


Introduction:

In the previous entry RTK GPS Unit was utilized to create accurate point collections. In this week we are using the RTK GPS Unit again but with some added surveying equipment. The Topcon Total Station and the Prism Laser collector. This is a useful application that is similar to the previous activity of the Distance/ Azimuth survey methods. The Major difference between the Distance/Azimuth survey and the Total Station survey methods is that this does the same surveying job but much better. This method will be used to survey points by using the total station for later use in building a micro topographic surface with the points that we have collected.

How Total Station works using Geographic Origin.
Methods:
Setting up the Topographic Survey and Total Station

This topographic Survey with total station was a group effort with another partner since one person needs to be in charge of the Prism mechanism and one person needs to enter the points into the RTK GPS Unit. Classmate Luke Prashak was here to assist in the collection of points.

To begin the setup of the RTK, Prism, and Total Station needs to be located and set into a correct designated static position. This position is called the static point or the occupied point. To correctly set up the static position of the total station due north needs to be found. This will then be taken with points that were set up with orange flags. By using the orange flags as backsight points we can now know the exact static point via the prism collection based on collecting the information on the orange flags. Because this system is dependent on mm accuracy we cannot touch the total station once it is set into the static position.
 Prof. Hupy in the field with Total Station and RTK unit 


The first step is to gather the backsights which are BS1, BS2 etc. Once the backsights are collected it is time to gather the occupied point where the Total Station will reside. In order to set up the TSS we have to ensure that the surface is clean and dirt free. After the surface is cleaned, extend all three legs equally and secure the locking mechanism for a sturdy base for the tripod. Once the base is set centered attach the tripod head over the point while remaining level. A good way to ensure centering is to drop a pebble from the center of the tripod head. Then step down firmly on the footpads to set the legs into position.

The instruments are next to set up. Center the tripod head and secure the instrument to the tripod and bring all the leveling screws to the natural position below the line on the screw post. From here look through the optical plummet for parallel and focus on the ground. With the laser plummet on, position the instrument directly over point by using leveling screws. Be sure to observe what two legs need to be adjusted to bring the bubble into the middle and do not move the third leg. Release the horizontal tangent lock and rotate the instrument until tubular level is parallel. Once everything is centered and level it is time to recheck the fine (tubular) bubble vial in position 1 and 2 and adjust as needed. If no adjustments are needed then measurements can begin to be made.

To take points we need to turn on the total station and switch on the Bluetooth which is located in the parameters portion in order for the Tesla to recognize it. Now it is possible to connect the RTK to Total Station. To begin the OCC/BS Set up go to the Home Screen for Magnet and select the Setup icon and then select the backsight icon. Enter all the needed information for the total station and for the Prism Rod. It is very important to keep the prism rod at the same measurements throughout the point capturing. If the rod needs to be moved it will have to be recorded in the Total Station that the prism was moved or it will throw the data collected and will not be nearly as accurate. Finally place the prism rod over the backsight point and gather the point. This is needed to zero out the total station for due North. Collect the GPS points with the Tesla in Magnet Using the total Station and Prism in the Survey icon screen.
Collection of Points with RTK and Total Station
The system is now ready to collect points. Looking through the viewfinder on the total station it is imperative to lock onto the prism system. After locating the prism system on the Total Station it is then possible to use the view finder to manually focus in on the prism. at the ranges we were dealing with the magnifier was not necessarily needed but it was useful to practice. We are then ready to collect the point, Signaling the person manning the RTK will then collect the point after a series of seconds the point is then collected and we can move on to the next adjacent point. The points collected will be used with additional points to later be imported into ArcGis and create a topographic map. 

Creating the map in ArcGis 

By using the data imported from the RTK and Total station in a .txt format it is possible to use the create feature tool from xy table and import the points into ArcMap. From here it is possible to use these points to create a IDW (inverse distance weighted) analysis which would include the z axis. IDW uses every point collected to create a raster that will give the analysis of height. To use this tool  import the xy and z data into the tool and then run the analysis. From this data the height is now mapped in a topographic manner. The lower the point will be green the higher the point will be red. 

Results: 
From the IDW the green points are the lower collected areas that are taken in the little Niagra river area and the higher points are the areas that are collected above the geographic origin point which is where the total station was located. This is an important tool in mapping areas that require height to be accurate to the nearest millimeter. 

collected points interpolated with IDW 

Conclusion: 
By using Total Station and RTK we can map areas with the greatest of accuracy. This is an important tool when using drones is either illegal or ill advised. The IDW tool is useful in creating a topographic map that can be used for analysis in other areas.