Introduction:
In the previous lab we worked on moving the data that we
collected into a xyz table. This table however was not standardized. To normalize
this data we have to go and create it into a basic xyz table with only three
columns in excel. Normalizing data means adjusting the values measured on
different scales to a notionally common scale. Where the intention is to bring
the entire probably distributions of adjusted values into alignment. Our data
points and how the interpolation procedure will help to visualize this data.
Methods:
First we have to normalize our data. To do this our group
had to look at all the collected data and enter it into excel using only three columns.
This allows us to interpolate correctly when we enter it into excel. When we
enter the data into excel we have to create a new Geo database and import the xy
table into this database so we can use the data we collected as a point system.
After the data is imported we can begin interpolation.

Normalized table data
IDW is an acronym for inverse distance weighted technique.
IDW is a spatial analyst function that determines cell values using a linearly
weighted combination of a set of sample points. The weight is a function of
inverse distance and the surface being interpolated should be that of a locational
dependent variable. Ideally the more distant locations will have less of an
influence on areas that are closer to other sample points.

Inverse Distance Weighted Interpolation
Natural Neighbors is an interpolation technique that applies
weights to sample points based on proportionate areas to interpolate a value. By
using an area that is near a point it will pass through that inputs sample and
smooth everywhere except at locations of the input samples creating a fluid
output.

Natural Neighbors Interpolation
Kriging is an interpolation technique that chooses to
optimize smoothness of the fitted values. Kringing is used to give the best
linear unbiased prediction of the intermediate values instead of the absolute
max and min values that are inputted into Arc GIS

A sample of Kriging Interpolation, Ridge is not pronounced due to error in sampling
Spline is an interpolation technique that is a smoothing
function, this is much like Kriging except it uses the absolute min and max
inputs to create a smooth interpolation

A Sample of Spline Interpolation
TIN is short for triangulated irregular network. It is a
digital data structure for the representation of a surface in a vector based representation
of the physical land surface based on the xyz coordinates in polygonal
triangles.

A sample of TIN interpolation
When we imported the data into Arcscene to get it to project
properly we had to extort the data as a point feature class based on the xyz
table so Arcscene could properly project in 3d.
The results of the method are for the most part quit good
however there are some places that need to be redone with a better more tight
survey data. For example, the ridge was not projected correctly the group had
to go back outside and redo this to create a better representation.

The Ridge has been re-sampled

Corrected Kringing, notice the ridge is better projected than the previous Kriging
This survey relates to other field based surveys because it
is important how to learn how to use tools to create three dimensional
locations based on data. This can be used in many different scenarios where
models would have to be used before field data can be collected. This is
important since models can be used to represent real world scenarios and can be
based upon actual representations of the land before actual data points would
be collected.
Results:
When we first imported into Arc Map the group was dismayed
to find that the ridge feature was not projecting properly. To project this
ridge properly we decided to go back out into the field to recollect points in
a more dense fashion. When we re-projected the xyz table into ArcMap the ridge
was finally being projected to an orientation that we were happy with.
Each interpolation technique is useful in their own way but
for our project we decided to settle on Kriging since it give the most
aesthetically pleasing map. The Kriging method also has the added bonus of
averaging out the variables that we collected.
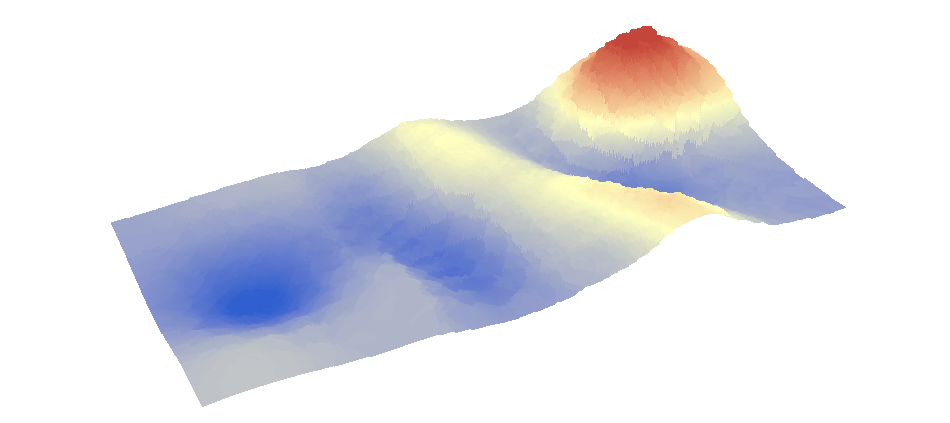
3D projection of Kriging with corrected Ridge
Summary:
This survey was useful to using detailed grid based survey
methods to help collect points. Because the first survey was not accurate and didn’t
collect all the points needed for the ridge part we had to go back out and
recollect points. It was useful to see how the grid points can be used to
easily collect data for Arc GIS. This was also a useful lab to see how we
can go and re collect points that were skewed. With the grid system it was a
snap to go back out and re collect data since we knew exactly where to go to
collect. It was also interesting to see that interpolation can be used for
elevation. This can be a powerful feature that can be used for other data
besides elevation such as population density and income differences.
No comments:
Post a Comment