Introduction:
In the previous entry RTK GPS Unit was utilized to create
accurate point collections. In this week we are using the RTK GPS Unit again
but with some added surveying equipment. The Topcon Total Station and the Prism
Laser collector. This is a useful application that is similar to the previous
activity of the Distance/ Azimuth survey methods. The Major difference between
the Distance/Azimuth survey and the Total Station survey methods is that this
does the same surveying job but much better. This method will be used to survey
points by using the total station for later use in building a micro topographic
surface with the points that we have collected.

How Total Station works using Geographic Origin.
Methods:
Setting up the Topographic Survey and Total Station
This topographic Survey with total station was a group effort
with another partner since one person needs to be in charge of the Prism
mechanism and one person needs to enter the points into the RTK GPS Unit.
Classmate Luke Prashak was here to assist in the collection of points.
To begin the setup of the RTK, Prism, and Total Station
needs to be located and set into a correct designated static position. This
position is called the static point or the occupied point. To correctly set up
the static position of the total station due north needs to be found. This will
then be taken with points that were set up with orange flags. By using the
orange flags as backsight points we can now know the exact static point via the
prism collection based on collecting the information on the orange flags. Because
this system is dependent on mm accuracy we cannot touch the total station once
it is set into the static position.

Prof. Hupy in the field with Total Station and RTK unit
The first step is to gather the backsights which are BS1, BS2 etc. Once
the backsights are collected it is time to gather the occupied point where the
Total Station will reside. In order to set up the TSS we have to ensure that
the surface is clean and dirt free. After the surface is cleaned, extend all
three legs equally and secure the locking mechanism for a sturdy base for the
tripod. Once the base is set centered attach the tripod head over the point while remaining
level. A good way to ensure centering is to drop a pebble from the center of
the tripod head. Then step down firmly on the footpads to set the legs into
position.
The instruments are next to set up. Center the tripod
head and secure the instrument to the tripod and bring all the leveling screws
to the natural position below the line on the screw post. From here look through
the optical plummet for parallel and focus on the ground. With the laser
plummet on, position the instrument directly over point by using leveling
screws. Be sure to observe what two legs need to be adjusted to bring the
bubble into the middle and do not move the third leg. Release the horizontal
tangent lock and rotate the instrument until tubular level is parallel. Once everything
is centered and level it is time to recheck the fine (tubular) bubble vial in
position 1 and 2 and adjust as needed. If no adjustments are needed then measurements
can begin to be made.
To take points we need to turn on the total station and
switch on the Bluetooth which is located in the parameters portion in order for
the Tesla to recognize it. Now it is possible to connect the RTK to Total
Station. To begin the OCC/BS Set up go to the Home Screen for Magnet and select
the Setup icon and then select the backsight icon. Enter all the needed information
for the total station and for the Prism Rod. It is very important to keep the
prism rod at the same measurements throughout the point capturing. If the rod
needs to be moved it will have to be recorded in the Total Station that the
prism was moved or it will throw the data collected and will not be nearly as accurate. Finally place
the prism rod over the backsight point and gather the point. This is needed to
zero out the total station for due North. Collect the GPS points with the Tesla
in Magnet Using the total Station and Prism in the Survey icon screen.
Collection of Points with RTK and Total Station
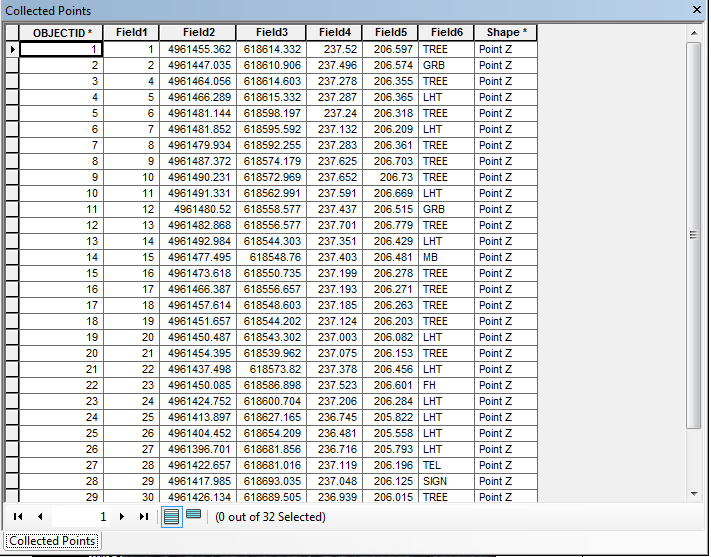
The system is now ready to collect points. Looking through the viewfinder on the total station it is imperative to lock onto the prism system. After locating the prism system on the Total Station it is then possible to use the view finder to manually focus in on the prism. at the ranges we were dealing with the magnifier was not necessarily needed but it was useful to practice. We are then ready to collect the point, Signaling the person manning the RTK will then collect the point after a series of seconds the point is then collected and we can move on to the next adjacent point. The points collected will be used with additional points to later be imported into ArcGis and create a topographic map.
Creating the map in ArcGis
By using the data imported from the RTK and Total station in a .txt format it is possible to use the create feature tool from xy table and import the points into ArcMap. From here it is possible to use these points to create a IDW (inverse distance weighted) analysis which would include the z axis. IDW uses every point collected to create a raster that will give the analysis of height. To use this tool import the xy and z data into the tool and then run the analysis. From this data the height is now mapped in a topographic manner. The lower the point will be green the higher the point will be red.
Results:
From the IDW the green points are the lower collected areas that are taken in the little Niagra river area and the higher points are the areas that are collected above the geographic origin point which is where the total station was located. This is an important tool in mapping areas that require height to be accurate to the nearest millimeter.

Conclusion:
By using Total Station and RTK we can map areas with the greatest of accuracy. This is an important tool when using drones is either illegal or ill advised. The IDW tool is useful in creating a topographic map that can be used for analysis in other areas.
From the IDW the green points are the lower collected areas that are taken in the little Niagra river area and the higher points are the areas that are collected above the geographic origin point which is where the total station was located. This is an important tool in mapping areas that require height to be accurate to the nearest millimeter.

collected points interpolated with IDW
Conclusion:
By using Total Station and RTK we can map areas with the greatest of accuracy. This is an important tool when using drones is either illegal or ill advised. The IDW tool is useful in creating a topographic map that can be used for analysis in other areas.